The electrocardiogram (ECG) is a ubiquitous and inexpensive diagnostic test used in pediatric and adult CHD practice worldwide. Artificial intelligence-enabled ECG (AI-ECG) has shown promise in the general adult population. However, AI-ECG applications in CHD are scarce. As a foundational step toward addressing this gap, we have developed and validated 1-D convolutional neural network AI-ECG models in the pediatric and adult CHD population to predict:
- Biventricular size and function
- Mortality
- Automated ECG diagnoses
- Critical CHD in newborns
To date, our AI-ECG technology remains limited by its:
- Dependence on digital waveform access for model inputs (limiting global reach)
- Reliance on clinical evaluation to obtain an ECG (restricting use to clinical settings)
- Lack of prospective evaluation across diverse cohorts and care settings (limiting safe and effective clinical adoption)
Ongoing projects aim to address each of these limitations by:
- Creating models that take ECG photos
- Generating AI-enabled wearable technology
- Prospective validation of AI-ECG tools
Addressing these crucial gaps will enable widespread use of algorithms and rigorously inform clinical decision-making, with the ultimate goal of democratizing access to pediatric cardiac care.
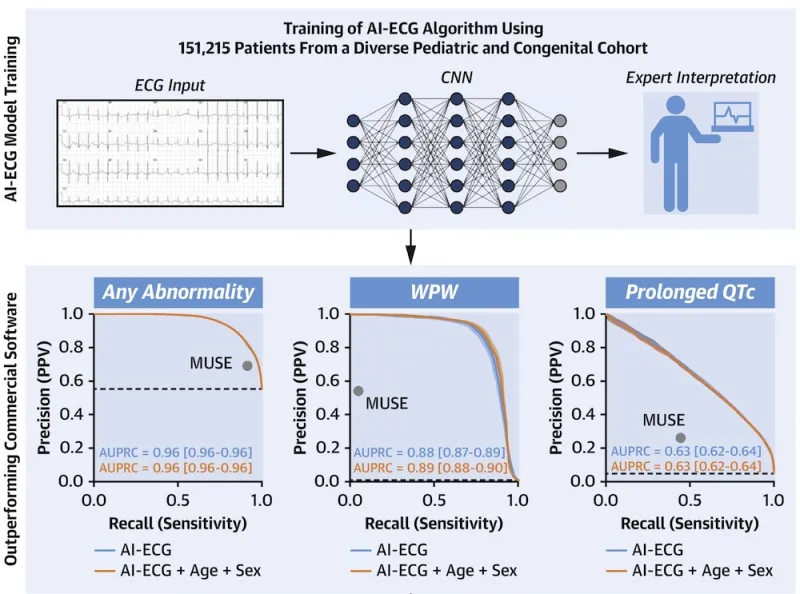
An illustration highlights aspects of the training of an AI-ECG (electrocardiogram) algorithm that used the ECG data of 151,215 patients from a diverse pediatric and congenital cohort. At top is the first of two rows of graphics offering a high-level overview of AI-ECG model training. From left to right: first, a graphic shows an example of ECG input with an illustration of an ECG graph. An arrow to the right of the graphic points to the next step of training, as seen in the second graphic. That graphic is an image of a convolutional neural network, or CNN. To the right of the CNN graphic is an arrow pointing to the third step, as seen in a graphic that illustrates expert interpretation. That graphic shows a shadowed figure of a person holding, in their left hand, a laptop displaying the lines of a heart’s electrical activity. The second row offers three X-Y axis graphs showing how AI-ECG models are capable of outperforming commercial software. Running vertically on the left side of each graph, the y-axis, are six numerical figures representing measurements of precision, also known as positive predictive value, or PPV. From top to bottom, the numeric measurements are 1.0, 0.8, 0.6, 0.4, 0.2, and 0.0. The x-axis running horizontally at bottom has three numeric measurements offering a range for recall, or sensitivity. Those figures are, from left to right, 0.0, 0.5, and 1.0. A light blue line on each graph represents the AI-ECG model’s output and an orange line represents the AI-ECG model’s output plus age plus sex. The first graph, at left, displays any abnormality. The orange line for AI-ECG plus age plus sex starts at top left, on the y-axis, at 1.0 and slopes downward, stopping just below 0.6 on the y-axis and above 1.0 on the x-axis. A circle representing MUSE is on the far-right of the graph, between the y-axis 0.8 and 0.6 and to the left above the x-axis 1.0. AUPRC of AI-ECG equals 0.96 [0.96-0.96], while AUPRC of AI-ECG plus age plus sex equals 0.96 [0.96-0.96]. The second graph, in the middle, displays WPW. The lines for AI-ECG and AI-ECG plus age plus sex run mostly together, starting on the y-axis at 1.0 and going across the graph at a mostly horizontal angle, before sloping downward around the 0.7 point of the x-axis, ending at bottom on the 1.0 x-axis mark. A circle representing MUSE is just below 0.6 on the y-axis and just beyond 0.0 on the x-axis. AUPRC of AI-ECG equals 0.88 [0.87-0.89], while AUPRC of AI-ECG plus age plus sex equals 0.89 [0.88-0.90]. The third graph, at right, displays prolonged QTc. The lines for AI-ECG and AI-ECG plus age plus sex run mostly together, sharply diving downward at a slant from the 1.0 mark of the y-axis to the 1.0 x-axis mark. A circle representing MUSE is just above 0.2 on the y-axis and to the left side of 0.5 on the x-axis. AUPRC of AI-ECG equals 0.63 [0.62-0.64], while AUPRC of AI-ECG plus age plus sex equals 0.63 [0.62-0.64].